Where does the data come from?
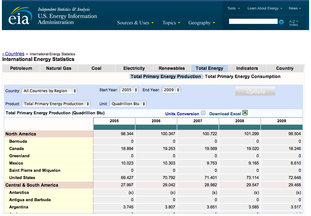
The data is provided by the US Energy Information Administration, and it goes from 1980 through 2009. The data that was included in this application is:
The data was not in any way modified, but simply converted from the excel format to a text version (tab separated values). Some more consideration has to be made on missing data. On the program you will find indications on the right telling you if the data is not available, or the country did not exist at that time.
- Total primary energy production
- Total primary energy consumption
- Total primary energy consumption per capita
- Total carbon dioxide emissions from the consumption of Energy
- Per capita carbon dioxide emissions from the consumption of Energy
- Total renewables electricity generation
- Population
The data was not in any way modified, but simply converted from the excel format to a text version (tab separated values). Some more consideration has to be made on missing data. On the program you will find indications on the right telling you if the data is not available, or the country did not exist at that time.
